

Your Personal Inflation Rate: Why Nebraska Retirees May Experience Inflation Differently
What if the national inflation rate is slowing, but your property taxes, insurance premiums and grocery bills are still climbing?
Picture a retired couple who read that inflation has cooled, then the mail arrives. The homeowners policy is up again. The county tax statement is higher. The Medicare Part B premium took a bigger bite out of the Social Security deposit than this year's cost-of-living increase added to it. Nothing changed about their lifestyle, yet the checkbook says otherwise.
Both things can be true at once. The national figure and their household experience measure different things, and the gap between them is your retirement inflation rate.
What the National Inflation Rate Actually Measures
The Consumer Price Index, or CPI, published by the U.S. Bureau of Labor Statistics, measures the average change over time in prices paid by urban consumers for a broad basket of goods and services. It was never designed to calculate one household's cost of living. BLS puts it plainly: "A national average reflects millions of individual price experiences; it seldom mirrors a particular consumer's experience." (BLS CPI questions and answers)
Two structural details explain most of the gap.
The basket is weighted. As of December 2025, housing was about 44.5 percent of the CPI-U, transportation 16.3 percent, food 13.7 percent and medical care 8.4 percent. (BLS relative importance tables) If your household spends 19 percent of its budget on healthcare, the index is not describing you.
Some homeowner costs sit outside the index entirely. The CPI treats buying a home as an investment, not consumption. BLS states that "interest costs (such as mortgage interest), property taxes, real estate fees, most maintenance" are out of scope, along with structural and liability coverage in a homeowners policy. (BLS owners' equivalent rent fact sheet) For a mortgage-free Nebraska homeowner whose fastest-rising bills are the tax statement and the insurance premium, that matters.
Five terms are worth keeping straight:
- Inflation: the rate at which prices increase.
- Disinflation: prices still rising, just more slowly.
- Deflation: a broad decline in prices.
- Cost of living: what your household needs to maintain its lifestyle.
- Personal inflation: an educational estimate based on what you actually spend.
Disinflation does the most damage to expectations. A lower reading does not mean prices are returning to where they were. It means the climb is less steep.
What current data does and does not tell a Nebraska household
For the 12 months ending July 2026, the national CPI-U rose 3.4 percent, while the index excluding food and energy rose 2.5 percent. In that same period, gasoline rose 24.6 percent, electricity 4.2 percent, shelter 3.2 percent and medical care services 2.7 percent. (BLS Consumer Price Index Summary, July 2026) One headline number sits on top of categories moving in very different directions.
There is also no Consumer Price Index for Nebraska, and none for Omaha or Lincoln. The closest published measure is the Midwest region index, covering 12 states, which rose 3.5 percent over the same 12 months. (BLS Consumer Price Index, Midwest region) A twelve-state average is context, not a measurement of Beatrice or Fairbury. The CPI-U also covers only urban households in metropolitan areas and in urban places of 10,000 residents or more, so rural nonmetropolitan and farm households are not represented in it.
Why a Nebraska Retirement Inflation Rate Can Feel Different
Here is where Nebraska households often diverge from the national basket.
Housing and property taxes
A renter feels market rents directly. A homeowner with a mortgage feels taxes, insurance and upkeep instead. A mortgage-free homeowner has no shelter payment at all, which is exactly why a rising valuation notice can feel jarring.
Nebraska property taxes are levied locally, not by the state, and school districts collect the largest share. Residential property is generally assessed at or near 100 percent of market value, agricultural land at or near 75 percent. (Nebraska Legislature, The Basics of Nebraska's Property Tax) Because valuations, levies and relief eligibility differ by county and household, no article can tell you what your bill will do.
Two programs are worth confirming rather than assuming. The school district property tax credit created by LB 34 now appears directly on the property tax statement for taxes levied after December 31, 2023, rather than on the income tax return. (Nebraska Department of Revenue property tax credits) The Nebraska Homestead Exemption is separate, filed with your county assessor on Form 458, and covers homeowners age 65 and older, certain disabled individuals, and certain disabled veterans and surviving spouses, subject to sliding-scale income and valuation limits. (Nebraska Department of Revenue homestead exemption)
Home maintenance and utilities
A paid-off house is not a free house. Roofs, furnaces, water heaters, siding, tree work, water and sewer, trash service and appliance replacement continue, and many are irregular, which is why they slip out of monthly budgets and reappear as a shock.
Nebraska is served by publicly owned electric utilities, and the state's average retail electricity price across all sectors was 9.07 cents per kilowatthour in 2024, among the lowest in the nation. (EIA Nebraska electricity profile) A favorable rate still does not fix your bill. Usage, weather and insulation move it.
Healthcare and Medicare
This is where retiree budgets most often part company with the national index. For 2026, the standard Medicare Part B premium is $202.90 per month, up from $185.00 in 2025, an increase of 9.7 percent. The annual Part B deductible is $283, up from $257, and the Part A inpatient hospital deductible is $1,736. (CMS 2026 Medicare Parts A and B premiums and deductibles) For Part D in 2026, no plan may have a deductible above $615, and out-of-pocket spending on covered drugs is capped at $2,100. (Medicare.gov drug coverage costs)
Compare that with the 2.8 percent Social Security cost-of-living adjustment for 2026. (SSA 2026 COLA fact sheet) When a large, unavoidable premium rises faster than the benefit increase that helps fund it, the net deposit tells a different story than the headline. Dental, vision and hearing care are generally paid out of pocket under Original Medicare, and a year with a joint replacement is not a year of price increases.
Insurance
Homeowners, auto, umbrella and long-term care premiums change for reasons that often have little to do with general inflation: claims experience in your area, hail and wind losses, replacement cost of materials, your deductible, coverage changes and other underwriting factors. The Nebraska Department of Insurance publishes consumer resources and a complaint process. (Nebraska Department of Insurance) Nothing here is an insurance recommendation, only a reminder to read the renewal notice.
Groceries and household supplies
USDA's Economic Research Service, updated August 25, 2026, projects all food prices to rise 3.0 percent in 2026, with food at home up 2.5 percent. Underneath that average, beef and veal are forecast up 9.8 percent while eggs are forecast down 30.8 percent. (USDA Food Price Outlook) Two households shopping the same store on the same day can see very different food inflation, depending on what goes in the cart.
Transportation
Fuel, insurance, tires, maintenance, registration and eventual vehicle replacement all count, and rural households often drive farther for appointments, shopping and grandchildren. For the week ending September 7, 2026, the Midwest average retail price for regular gasoline was $3.894 per gallon. (EIA Midwest gasoline prices) Drive 22,000 miles a year and a fuel price change affects you about twice as much as a neighbor who drives 11,000.
Travel and recreation
For some households travel is the first thing cut. For others it is the point of retirement. Airfare, lodging, fuel and restaurant meals carry far more weight in a travel-oriented retiree's estimate than in the national index.
The inflation rate in the headlines is an average. The inflation rate in your retirement plan is personal.
A Personal Inflation Worksheet You Can Fill Out
Gather two comparable years from bank and credit card statements, the property tax statement, insurance declarations, Medicare and pharmacy records, and any budgeting software. Use the same 12-month window each year.
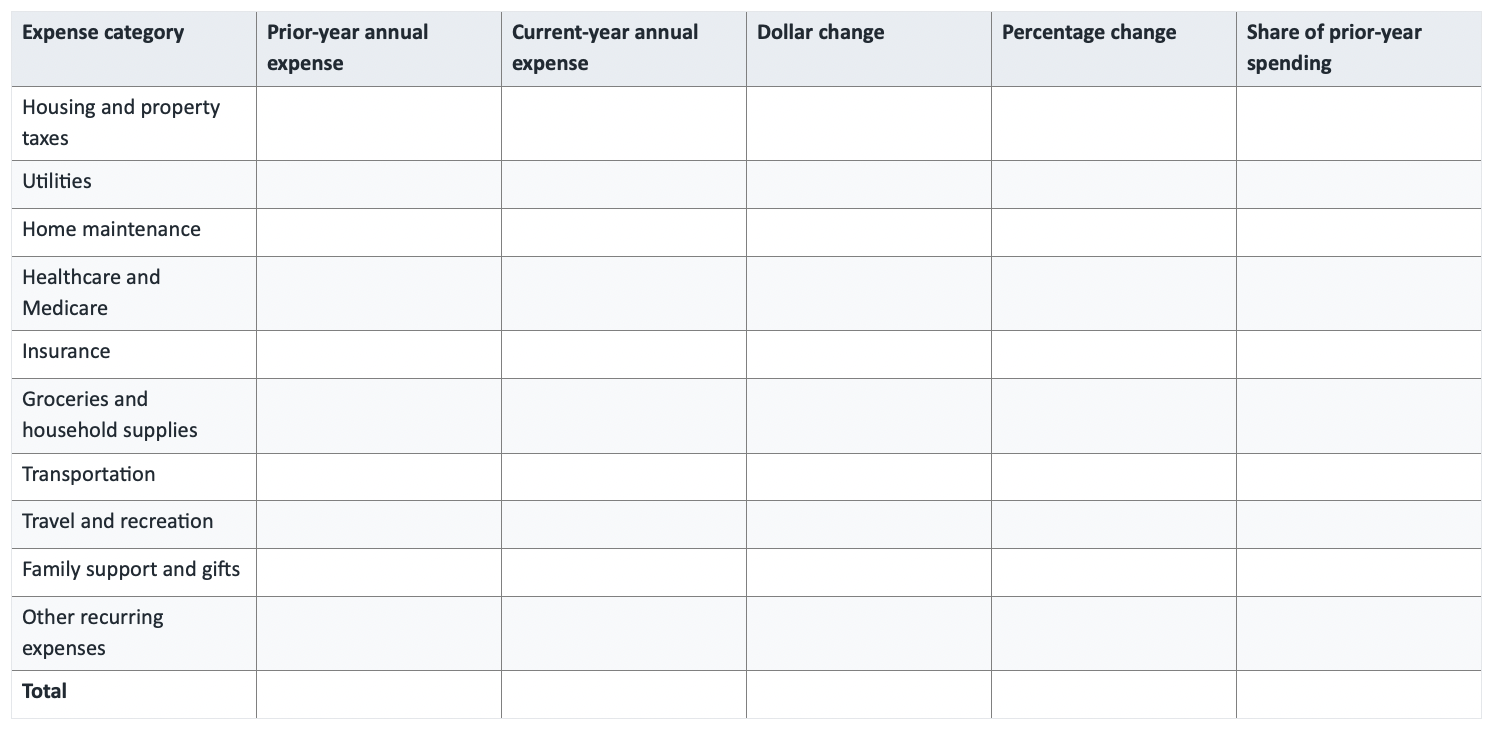
Dollar change: current-year expense minus prior-year expense.
Category percentage change:
(Current-year expense minus Prior-year expense) ÷ Prior-year expense × 100
Simplified personal inflation estimate:
(Current-year total minus Prior-year total) ÷ Prior-year total × 100
Weighted approach, to see which categories drove the result:
- Divide each category's prior-year expense by total prior-year expenses to get its weight.
- Multiply that weight by the category's percentage change.
- Add the weighted changes together.
With the same categories and periods, both methods give the same answer. The weighted version simply shows where the increase came from.
What the Worksheet Cannot Tell You
A change in spending is not always a change in prices. Any of these will distort the result:
- Buying a more expensive vehicle
- Taking an additional vacation
- Moving to another home
- Adding coverage or changing a deductible
- Supporting a family member
- A one-time medical procedure
- Eating at restaurants more often
- Replacing a roof or a heating system
- Driving or traveling less than last year
- A change in household size
Separate price changes from changes in quantity, quality, lifestyle and one-time events. Many households calculate three figures: a core recurring-expense rate, a total-spending change, and a separate list of unusual costs. This is an educational planning estimate, not an official statistic.
A Hypothetical Nebraska Example
Hypothetical illustration. Ray and Diane are fictional. They are not clients of Garnett Investment Strategies, and these figures do not represent any actual household or guarantee future results.
Both are 71, live in a mortgage-free home in southeastern Nebraska, drive about 18,000 miles a year between them, and are enrolled in Medicare with supplemental coverage. The table shows recurring expenses only.
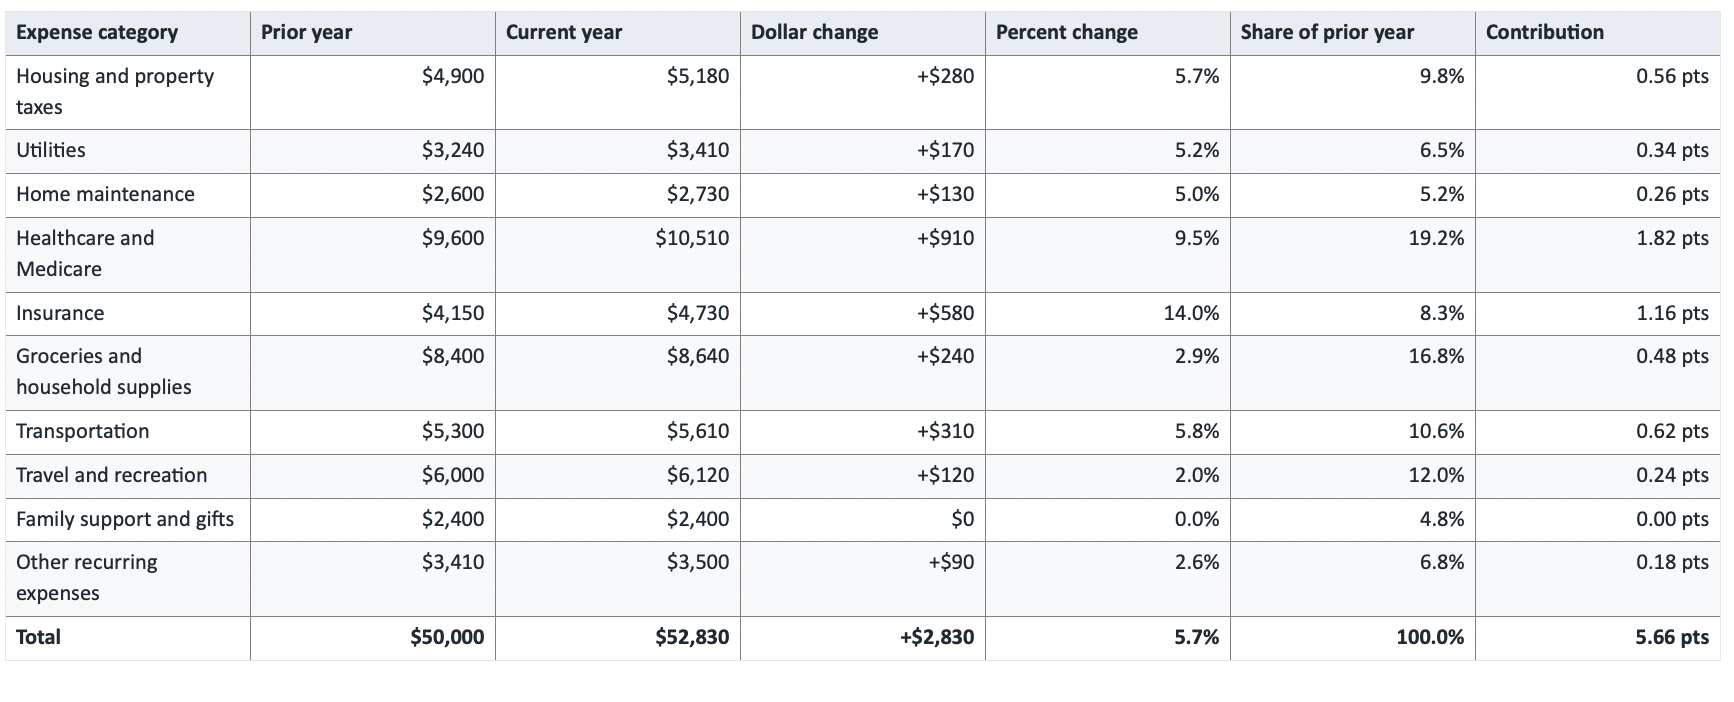
Their estimated personal inflation rate is 5.7 percent, or $2,830 divided by $50,000. The weighted method returns the same 5.66 percent and shows why: healthcare contributed 1.82 percentage points and insurance 1.16. Those two categories drove more than half the increase despite being only 27.5 percent of prior-year spending.
That runs above the 3.4 percent national CPI reading for the same period, not because the national figure is wrong, but because their spending weights are not the national weights. A different Nebraska household, one with lower medical costs or recently shopped insurance, could land below it.
What might they review next? Whether the increases are recurring, which expenses are essential and which are flexible, whether cash reserves still look appropriate, whether planned portfolio withdrawals still match actual spending, whether taxes and Medicare premiums were fully captured, and whether a major home, vehicle or healthcare expense is approaching.
Why This Matters in Retirement Income Planning
Most retirement projections apply a single general inflation assumption. That is reasonable, and it can still drift from what a household actually pays. An outdated expense assumption ripples into income projections, portfolio withdrawals, cash reserves, Social Security claiming analysis, pension elections, tax projections, healthcare budgets, long-term care preparation, gifting goals and a surviving spouse's security.
That last item deserves attention. When one spouse dies, one Social Security benefit generally stops, a pension election may change the survivor's income, and the filing status usually changes, yet property taxes, insurance and utilities do not fall by half.
Reviewing essential, healthcare and discretionary expenses separately can help, since they do not always move together. That does not mean every plan needs a different inflation assumption for every line item.
Common Inflation-Planning Mistakes
- Assuming every expense rises at the national CPI rate. Your weights are not the index's weights.
- Confusing slower inflation with falling prices. Disinflation is not deflation.
- Comparing incomplete years. Nine months against twelve will mislead you.
- Treating a one-time purchase as recurring inflation. A new truck is not an inflation rate.
- Ignoring taxes and insurance premiums. Often the fastest-moving lines for Nebraska homeowners.
- Overlooking irregular home and vehicle costs. Roofs and transmissions do not bill monthly.
- Focusing only on monthly bills. Annual and semiannual charges hide there.
- Cutting long-term investments because inflation feels uncomfortable. Discomfort is not a plan input.
- Changing a portfolio in response to headlines. Headlines describe the past.
- Failing to update the surviving spouse's budget. The expense side rarely halves.
Questions to Ask When Reviewing Your Retirement Inflation Rate
Print this and bring it to your annual review.
- Which essential expenses increased the most?
- Were the increases caused by higher prices or by changes in our lifestyle?
- Which one-time expenses should be excluded from the recurring comparison?
- Have property taxes, insurance and utilities been updated to current figures?
- Are all Medicare premiums and out-of-pocket healthcare costs included?
- Have we budgeted for home and vehicle maintenance?
- Has our travel or family-support spending changed?
- Does our current income plan reflect today's recurring expenses?
- Would the surviving spouse have a different expense pattern?
- Have we stress-tested the budget for higher-than-expected costs?
The national CPI remains valuable context. It just is not a measurement of your kitchen table.
A personal inflation estimate cannot predict what next year will cost, but it can show where your money went, which categories are moving, and which planning assumptions may be due for a refresh.
At Garnett Investment Strategies, a locally owned fiduciary in Beatrice, Nebraska, we believe your retirement inflation rate should reflect the expenses your household actually pays—not only the number appearing in national headlines.
Two questions for your spouse or family this week: which of our expenses grew the most last year, and would we notice if it happened again?
Garnett Investment Strategies is an independent, fiduciary Registered Investment Adviser in Nebraska, working with pre-retirees, retirees and families across southeastern Nebraska. If you would like a second set of eyes on your retirement expenses, income sources, portfolio withdrawals, taxes, healthcare costs and long-term family goals, we are glad to have an unhurried conversation.
It All Starts with a Phone Call
Primary Wealth Management dba Garnett Investment Strategies (“GIS”) is a registered investment adviser whose principal office is located in Nebraska. A copy of our current written disclosure statement discussing our advisory services and fees continues to remain available for your review upon request.